Rational Rose: The world's leading visual modeling tool based upon the UML 'unified modeling language' .
Diagram Types
The Unified Modeling Language was prepared by
Dr. James Rumbaugh and
Mr. Grady Booch of Rational
Software Corporation to provide the software
community
with a set of method-independent graphic notations
for recording
software system knowledge. These
notations are intended to facilitate the
exchange
of information between software professionals,
by providing them
with a common and consistent
set of diagrammatic notations for recording
software
system knowledge.
The diagrams of the Unified Modeling Language
represent typical artifacts
that software developers
might prepare to document a software system's
organization,
behavior, functionality and design. The diagrams
central
to the Unified Modeling Language are as
follows:
A description of each of these artifacts is provided
in this section.
Example artifacts may be found
in the Unified Modeling Language descriptions
available
from Rational Software Corporation at http://www.rational.com.
1. The Class Diagram
The class diagram represents the static structure
of the system, by
identifying the classes of the
system. For each class, its attributes,
operations,
and associations / relationships to other objects
are identified.
Relationships depicted include
hierarchical relationships with other objects
that
reflect both membership and specialization and
generalization. The
class diagram identifies all
of the classes for a proposed system and is
the
central diagram of the Unified Modeling Language.
2. The Use Case Diagram
The use case diagram depicts the external users
of a system, the boundary
of a system and all
or a portion of the use cases in which the system
is
comprised. Lines are drawn that connect each
external system and the use
case with which the
user interacts. A use case diagram also may show
use
cases that extend or other use cases. It may
also serve as a top-level
context diagram that
provides the common entry point to all of the
other
models that characterize a system's requirements,
architecture and implementation
3. Sequence diagrams
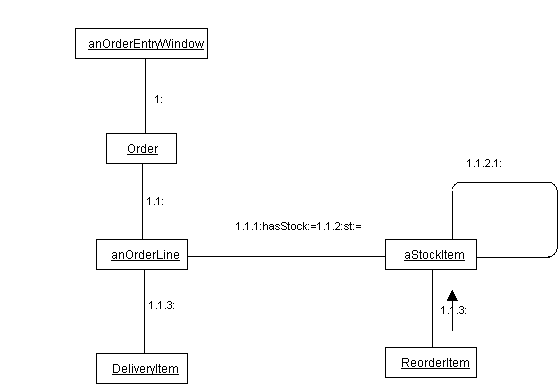
A pattern of interaction among objects is shown on an interaction diagram. Interaction diagrams come in two forms based on the same underlying information but each emphasizing a particular aspect of it: sequence diagrams and collaboration diagrams.
A sequence diagram shows an interaction arranged in time sequence. In particular, it shows the objects participating in the interaction by their ''lifelines'' and the messages that they exchange arranged in time sequence. It does not show the associations among the objects.
Sequence diagrams come in several slightly different formats intended for different purposes.
A sequence diagram can exist in a generic form (describes all the possible sequences) and in an instance form (describes one actual sequence consistent with the generic form). In cases without loops or branches, the two forms are isomorphic.
Sequence diagrams and collaboration diagrams express similar information but show it in different ways. Sequence diagrams show the explicit sequence of messages and are better for real-time specifications and for complex scenarios. Collaboration diagrams show the relationships among objects and are better for understanding all of the effects on a given object and for procedural design.

| 
